

Certificate & Degree Programs
Deepen your understanding on big data with online courses taught by SDSC experts.
Fellowships
SDSC and its partners provide a variety of fellowships for graduate students, postdoctoral fellows and early-career educators and researchers.

Internships
Learn directly from SDSC experts through internship opportunities available for graduate, undergraduate and high school students.
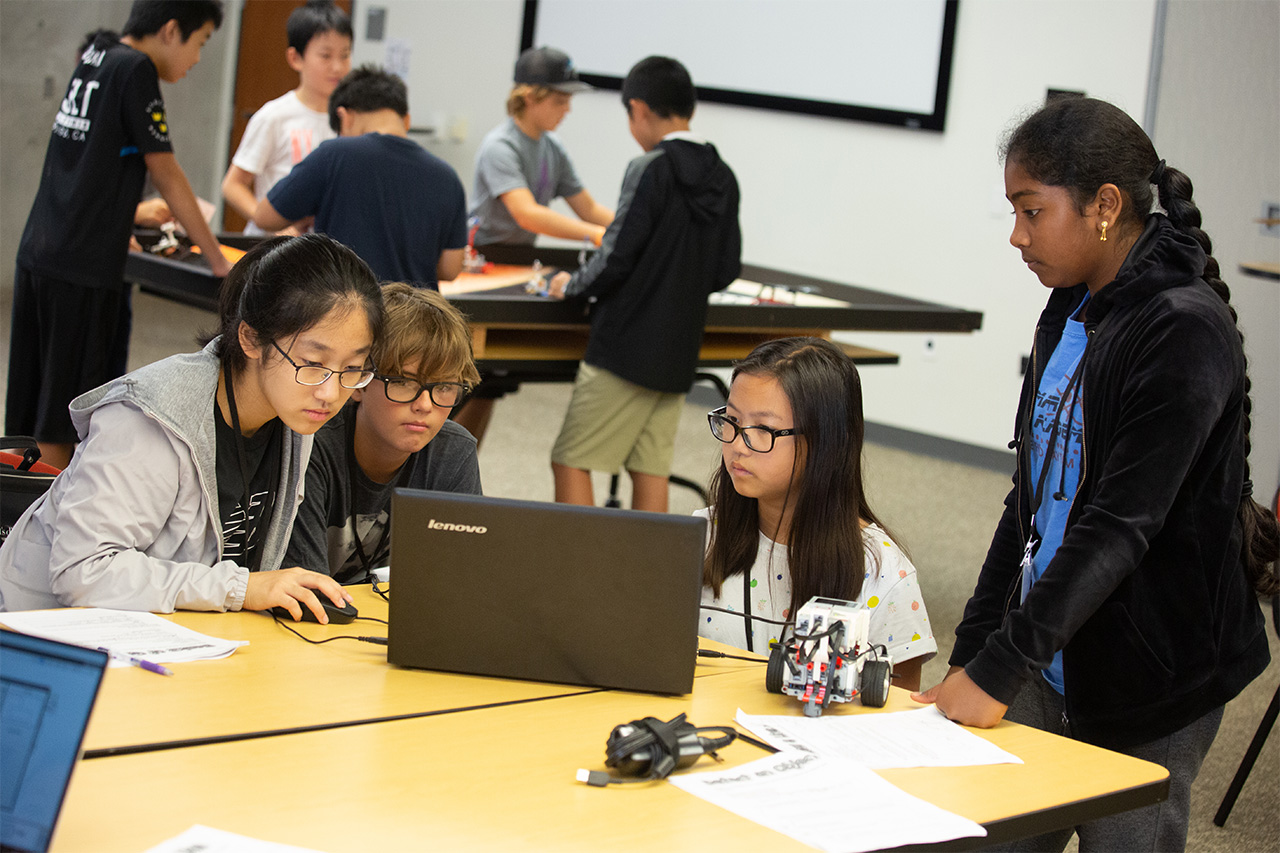
K-12 Programs
Inspiring future scientists, engineers and technologists, SDSC’s K-12 outreach fosters STEM engagement through workshops, internships and mentorship for students and educators.
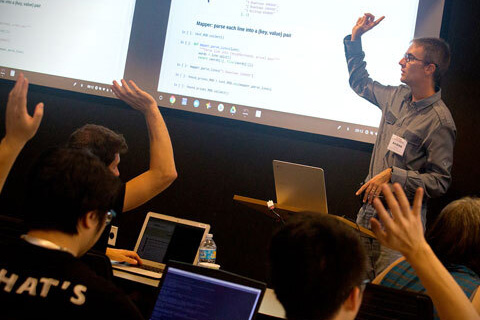
Training Programs
Participate in available training led by SDSC’s experts on high-performance computing, data science and analytics across diverse disciplines, from neuroscience to the humanities.

On-Demand Learning
Learn from on-demand training sessions with flexible access, self-paced videos, focused on high-performance computing, data science, advanced analytics and more.

Upcoming Events & Training
Stay informed about SDSC’s latest events, training sessions and workshops covering cutting-edge topics around emerging technologies, practical approaches for discovery and more.