
System Information
Hardware Specifications
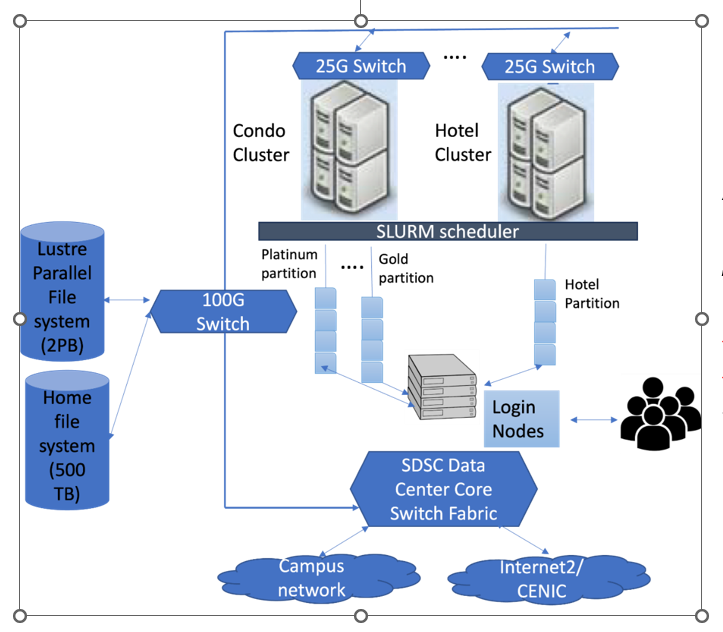
Figure 1: Hardware architecture of TSCC
Figure 1 illustrates the conceptual hardware architecture of TSCC system. At its core, this system comprises of several condo servers ("Condo Cluster") and hotel servers ("Hotel Cluster") with servers connected through 25G switches. The cluster is managed by the SLURM scheduler, which orchestrates job distribution and execution. The system also features a Lustre Parallel File system with a capacity of 2PB and a home file system holding 500TB. The TSCC cluster has RDMA over Converged Ethernet (RoCE) for networking across the servers. The architecture is further complemented by dedicated login servers that serve as access points for users. All these components are integrated into the core switch fabric, ensuring smooth data flow and connectivity to both the campus network and the broader Internet.
The servers in the condo and hotel clusters comprise of general computing servers with CPUs, and GPU servers with GPUs. The TSCC group will periodically update the hardware choices for general computing and GPU condo server purchases, to keep abreast of technological and cost advances. Please see the TSCC Condo page and TSCC Hotel page for specifications of the node types.
Available Nodes at TSCC
Below there is a summary of the nodes available currently at TSCC, for the Condo and Hotel programs.
|
Condo |
Hotel |
||
|
CPU node[2] |
Gold[1] Intel Xeon Gold 36-core 256GB |
Platinum[1] Intel Xeon Platinum 64-core 1 TB |
Intel Xeon Gold 28-core , 196 GB |
[1] CPU and GPU nodes are available for purchase.
[2] Legacy nodes exist. Not all nodes are the same as listed above.
[3] Sixteen V100 nodes are the latest addition to the Hotel program.
System Access
Acceptable Use Policy
All users of the Triton Shared Computing Cluster and associated resources must agree
to comply with the Acceptable Use Policy.
Acceptable Use Policy for CUI/CAD / NIST 800-171–
Compliant Operations:
In addition to the General TSCC AUP, users who process, store, or transmit Controlled Unclassified Information (CUI/CAD) on TSCC resources designated as NIST SP 800-171 compliant must agree to and comply with the CUI/CAD / NIST AUP.
This policy defines the additional responsibilities, security requirements, and required user behaviors for operating within TSCC’s NIST-compliant environment.
Users must explicitly acknowledge and sign the CUI/CAD / NIST AUP prior to being granted access to these restricted resources.
Please refer to the CUI/CAD / NIST Acceptable Use Policy (AUP) document for full details.
Getting a trial account:
If you are part of a research group that doesn’t have an allocation yet on TSCC, and never has, and you want to use TSCC resources to run preliminary tests, you can apply for a free trial account. For a free trial, email tscc-support@ucsd.edu and provide your:
- Name
- Contact Information
- Department
- Academic Institution or Industry
- Affiliation (grad student, post-doc, faculty, etc.)
- Brief description of your research and any software applications you plan to use
Trial accounts are 250 core-hours valid for 90 days.
Joining the Condo Program
Under the TSCC condo program, researchers use equipment purchase funds to buy compute (CPU or GPU) nodes that will be operated as part of the cluster. Participating researchers may then have dedicated use of their purchased nodes, or they may run larger computing jobs by sharing idle nodes owned by other researchers. The main benefit is access to a much larger cluster than would typically be available to a single lab. For details on joining the Condo Program, please visit: Condo Program Details.
Joining the Hotel Program
Hotel computing provides flexibility to purchase time on compute resources without the necessity to buy a node. This pay–as–you–go model is convenient for researchers with temporary or bursty compute needs. For details on joining the Hotel Program, please visit: Hotel Program Details
Logging In
TSCC supports command line authentication using your UCSD AD password. To login to the TSCC, use the following hostname:
login.tscc.sdsc.edu
Following are examples of Secure Shell (ssh) commands that may be used to login to the TSCC:
  $ ssh <your_username>@
										login.tscc.sdsc.edu


$ ssh -l <your_username> login.tscc.sdsc.edu
Then, type your AD password.
You will be prompted for DUO 2-Step authentication. You’ll be shown these options:
- Enter a passcode or select one of the following options:
- Duo Push to XXX-XXX-1234
- SMS passcodes to XXX-XXX-1234
- If you type 1 and then hit enter, a DUO access request will be sent to the device you set up for DUO access. Approve this request to finish the logging in process.
- I f you type 2 and then hit enter, an SMS passcode will be sent to the device you set up for DUO access. Type this code in the terminal, and you should be good to go.
For Windows Users, you can follow the exact same instructions using either PowerShell, Windows Subsystems for Linux (WSL) (a compatibility layer introduced by Microsoft that allows users to run a Linux environment natively on a Windows system without the need for a virtual machine or dual-boot setup), or terminal emulators such as Putty or MobaXterm. For more information on how to use Windows to access TSCC cluster, please contact the support team at tscc-support@ucsd.edu.
Set up multiplexing for TSCC Host
Multiplexing enables the transmission of multiple signals through a single line or connection. Within OpenSSH, this capability allows the utilization of an already established outgoing TCP connection for several simultaneous SSH sessions to a remote server. This approach bypasses the need to establish new TCP connections and authenticate again for each session. That is, you won't need to reauthenticate everytime you need to open a new terminal window for whatever reason.
Below you find instructions on how you can set it up for different OSs.
Linux or Mac:
In your local pc open or create this file: ~/.ssh/config, and add the following lines (use any text editor you like: vim, vi, vscode, nano, etc.):
|
|
Make sure the permission of the created config file is 600 (i.e.: chmod 600 ~/.ssh/config) . With that configuration, the first connection to login.tscc.sdsc.edu will create a control socket in the directory
~
/.ssh/%r@%h:%p; then any subsequent connections, up to 10 by default as set by MaxSessions on the SSH server, will re-use that control path automatically as multiplexed sessions.
While logging in you just need to type the following:
$ ssh tscc
Note that in the previous line you won't have to type the whole remote host address since you already configured that in the ~/.ssh/config file previously (` Host tscc`). Then you're all set.
Windows:
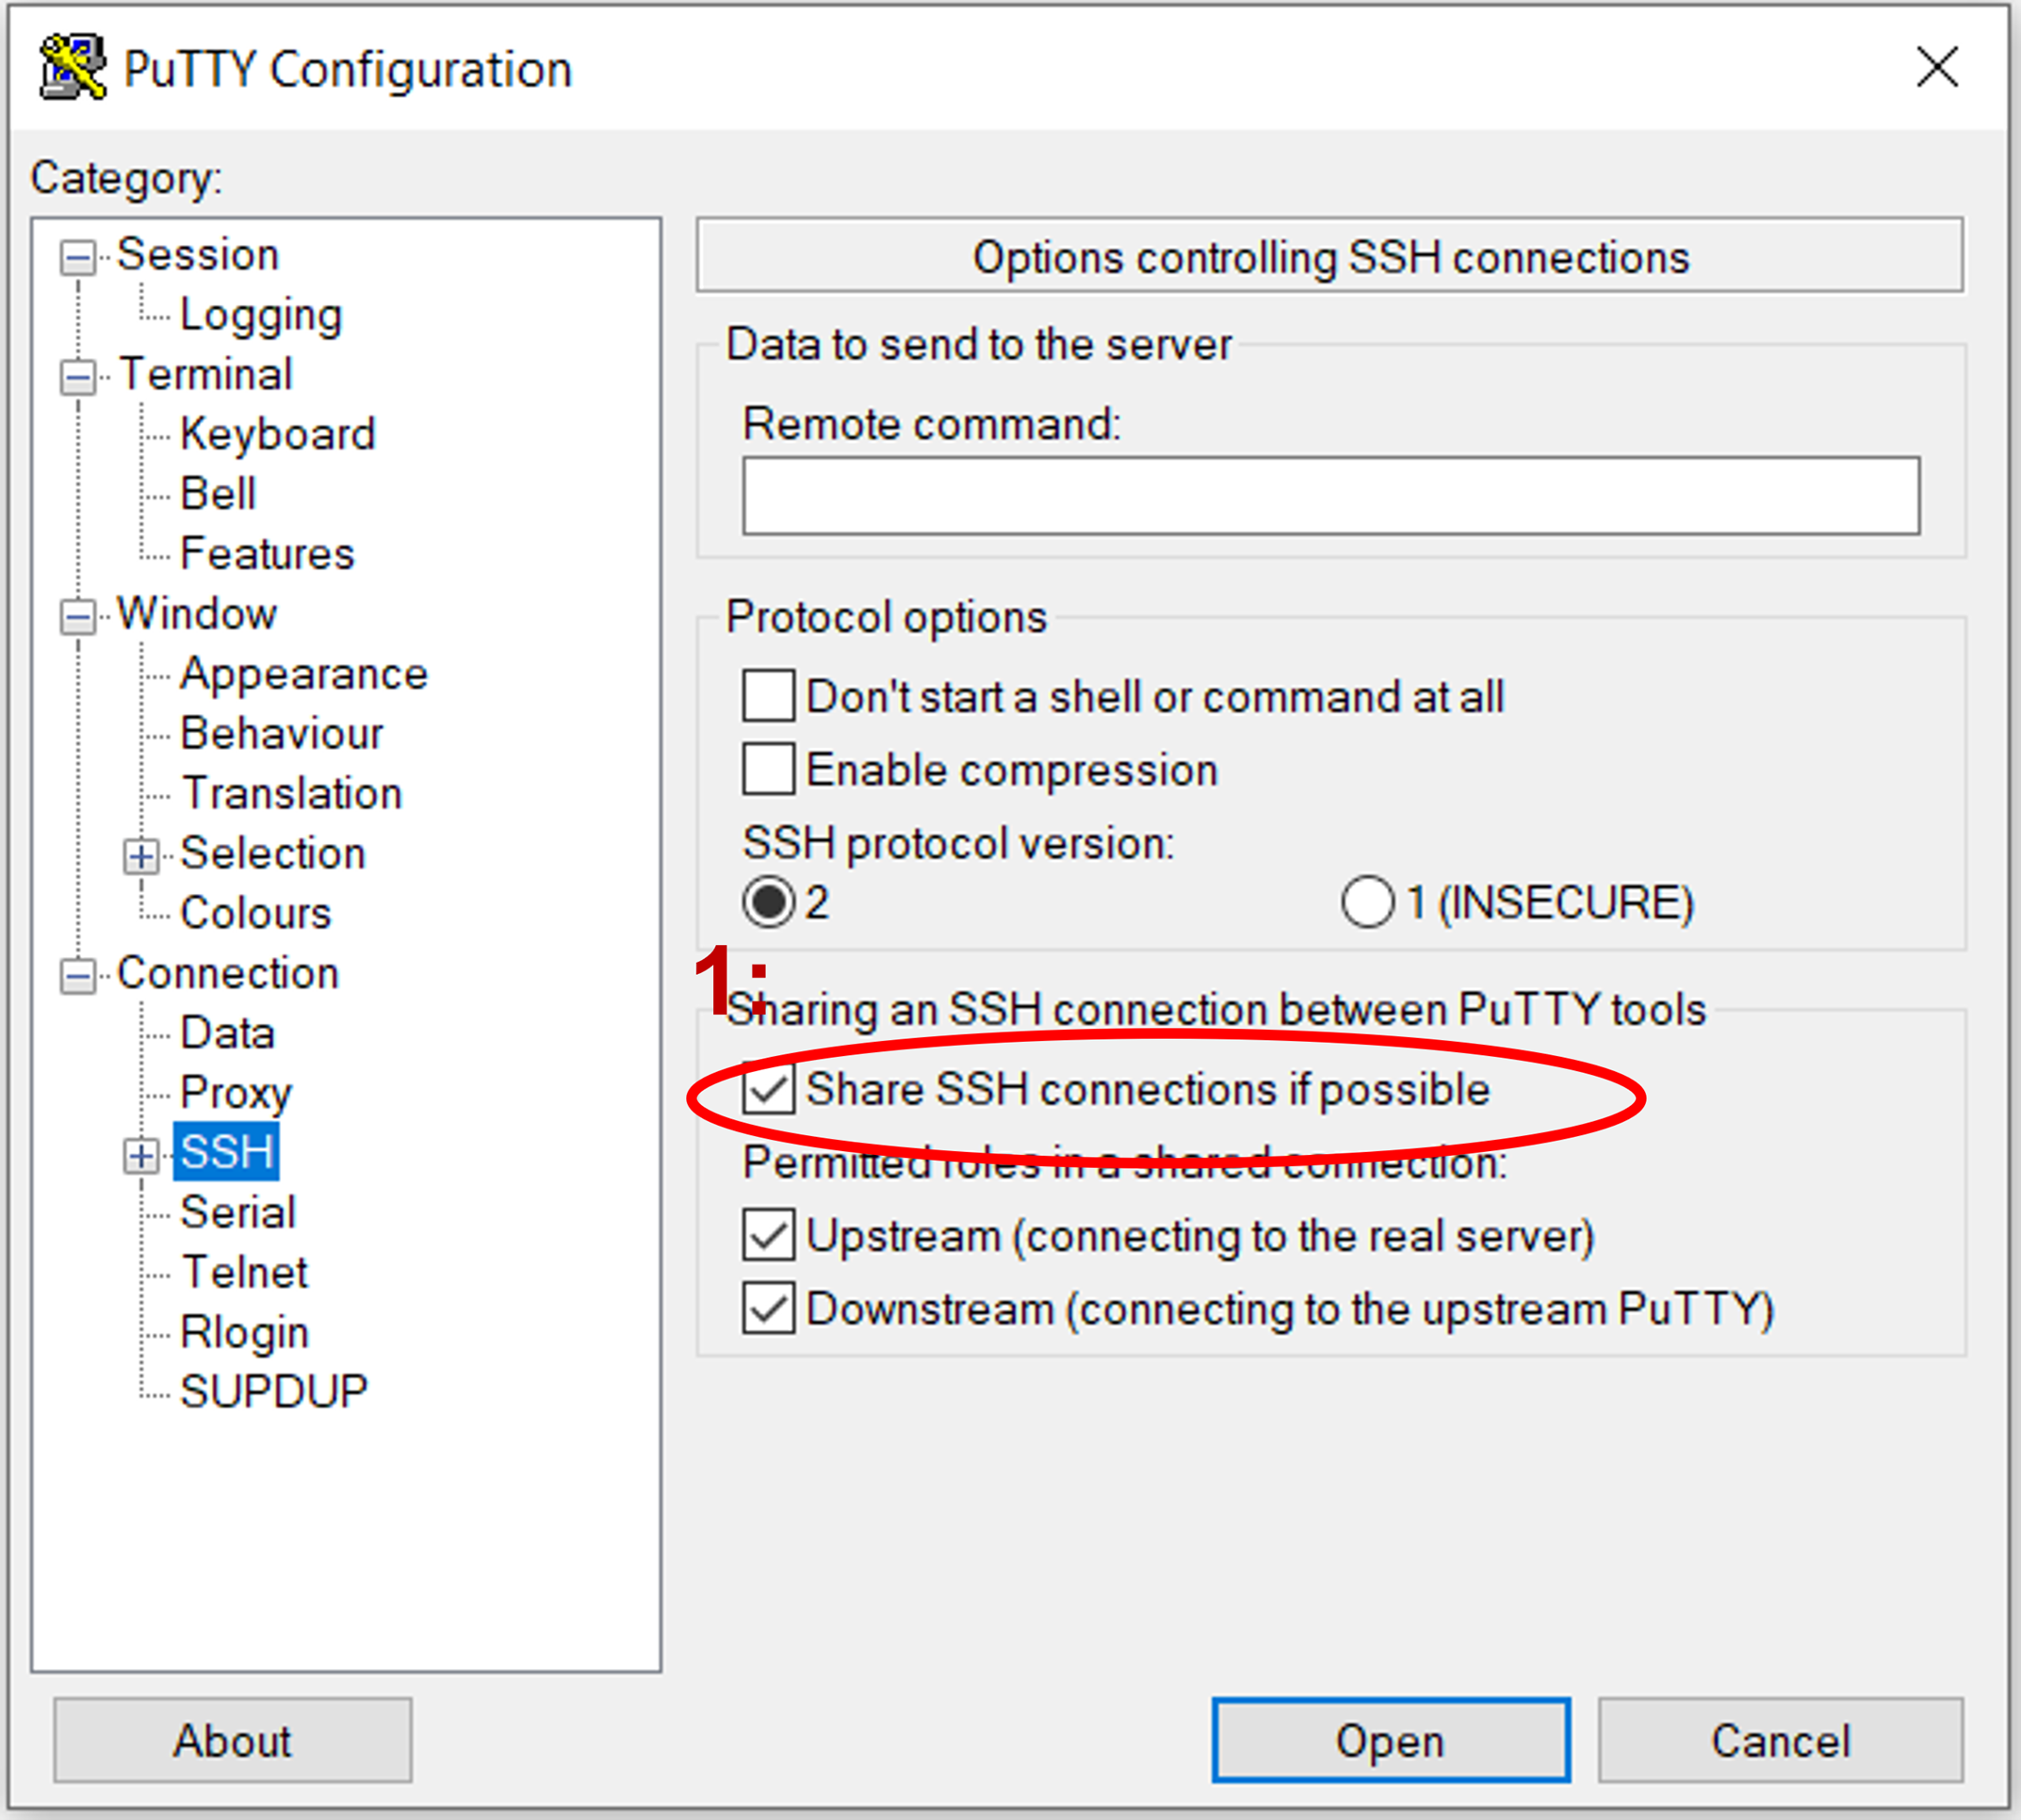
If you’re using PuTTY UI to generate ssh connections from your local windows pc, you can set it up so it uses multiplexing. To reuse connections in PuTTY, activate the "Share SSH connections if possible" feature found in the "SSH" configuration area. Begin by choosing the saved configuration for your cluster in PuTTY and hit "Load". Next, navigate to the "SSH" configuration category.
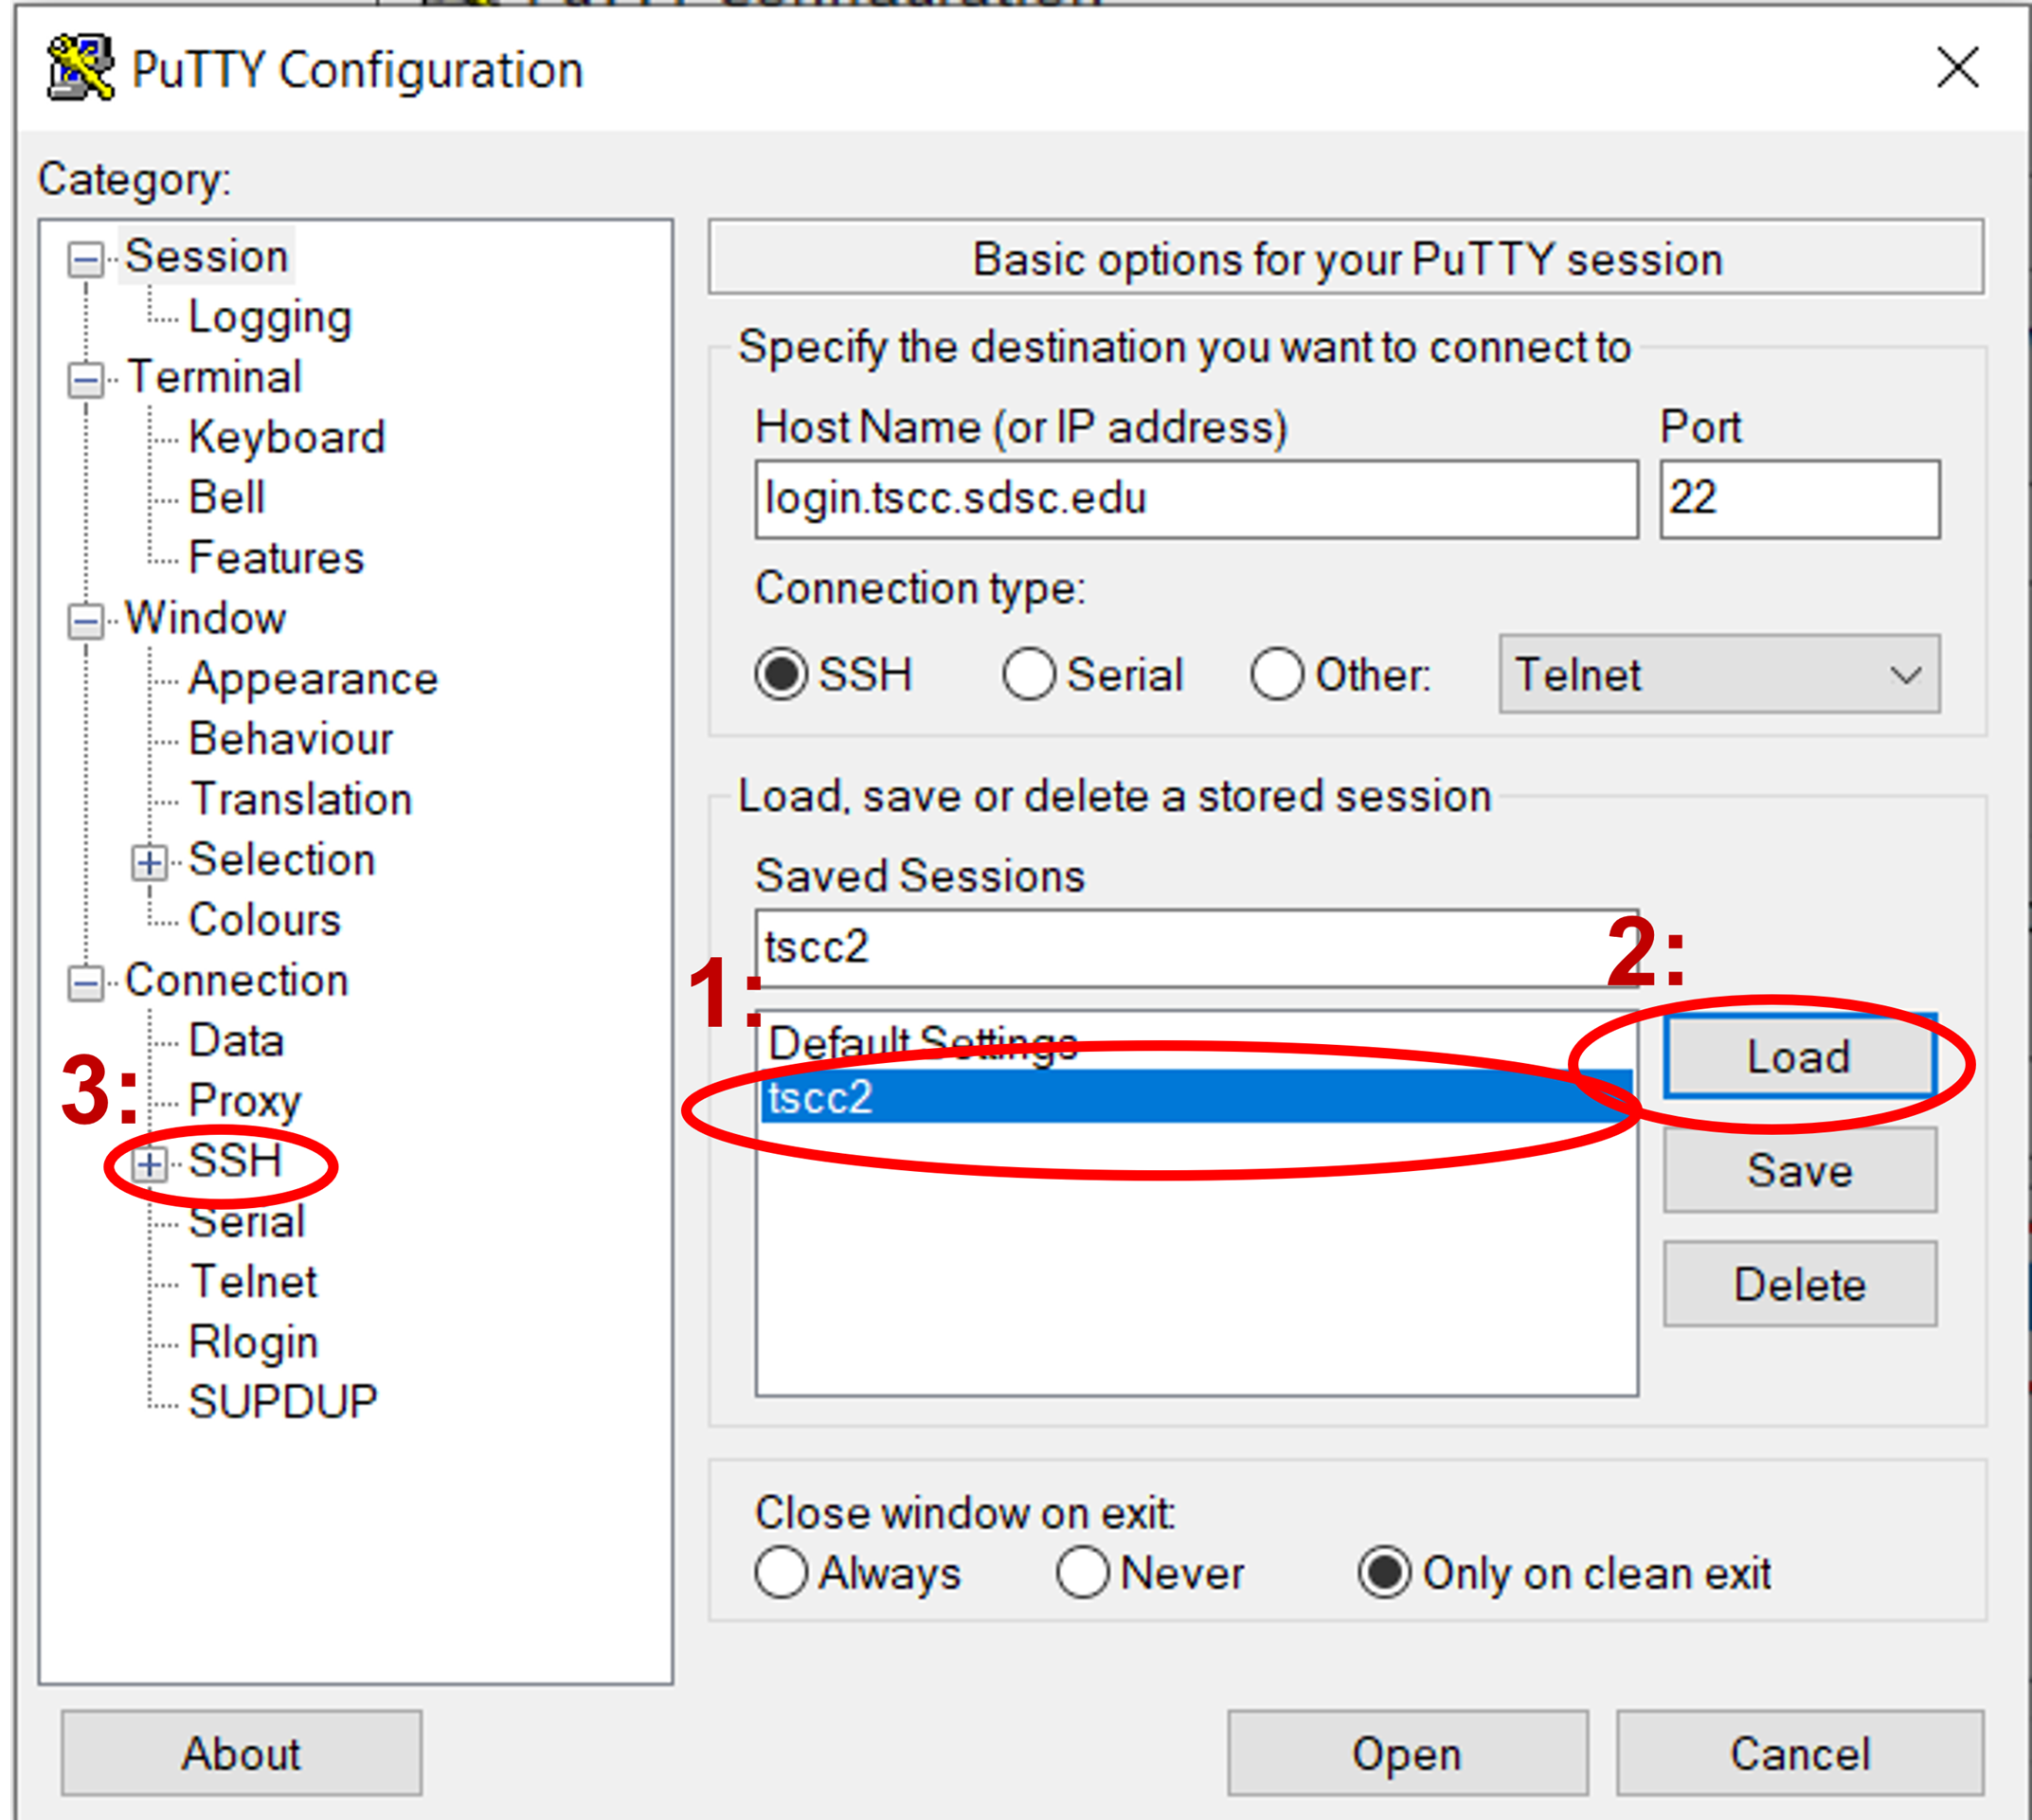
Check the “Share SSH connections if possible” checkbox.
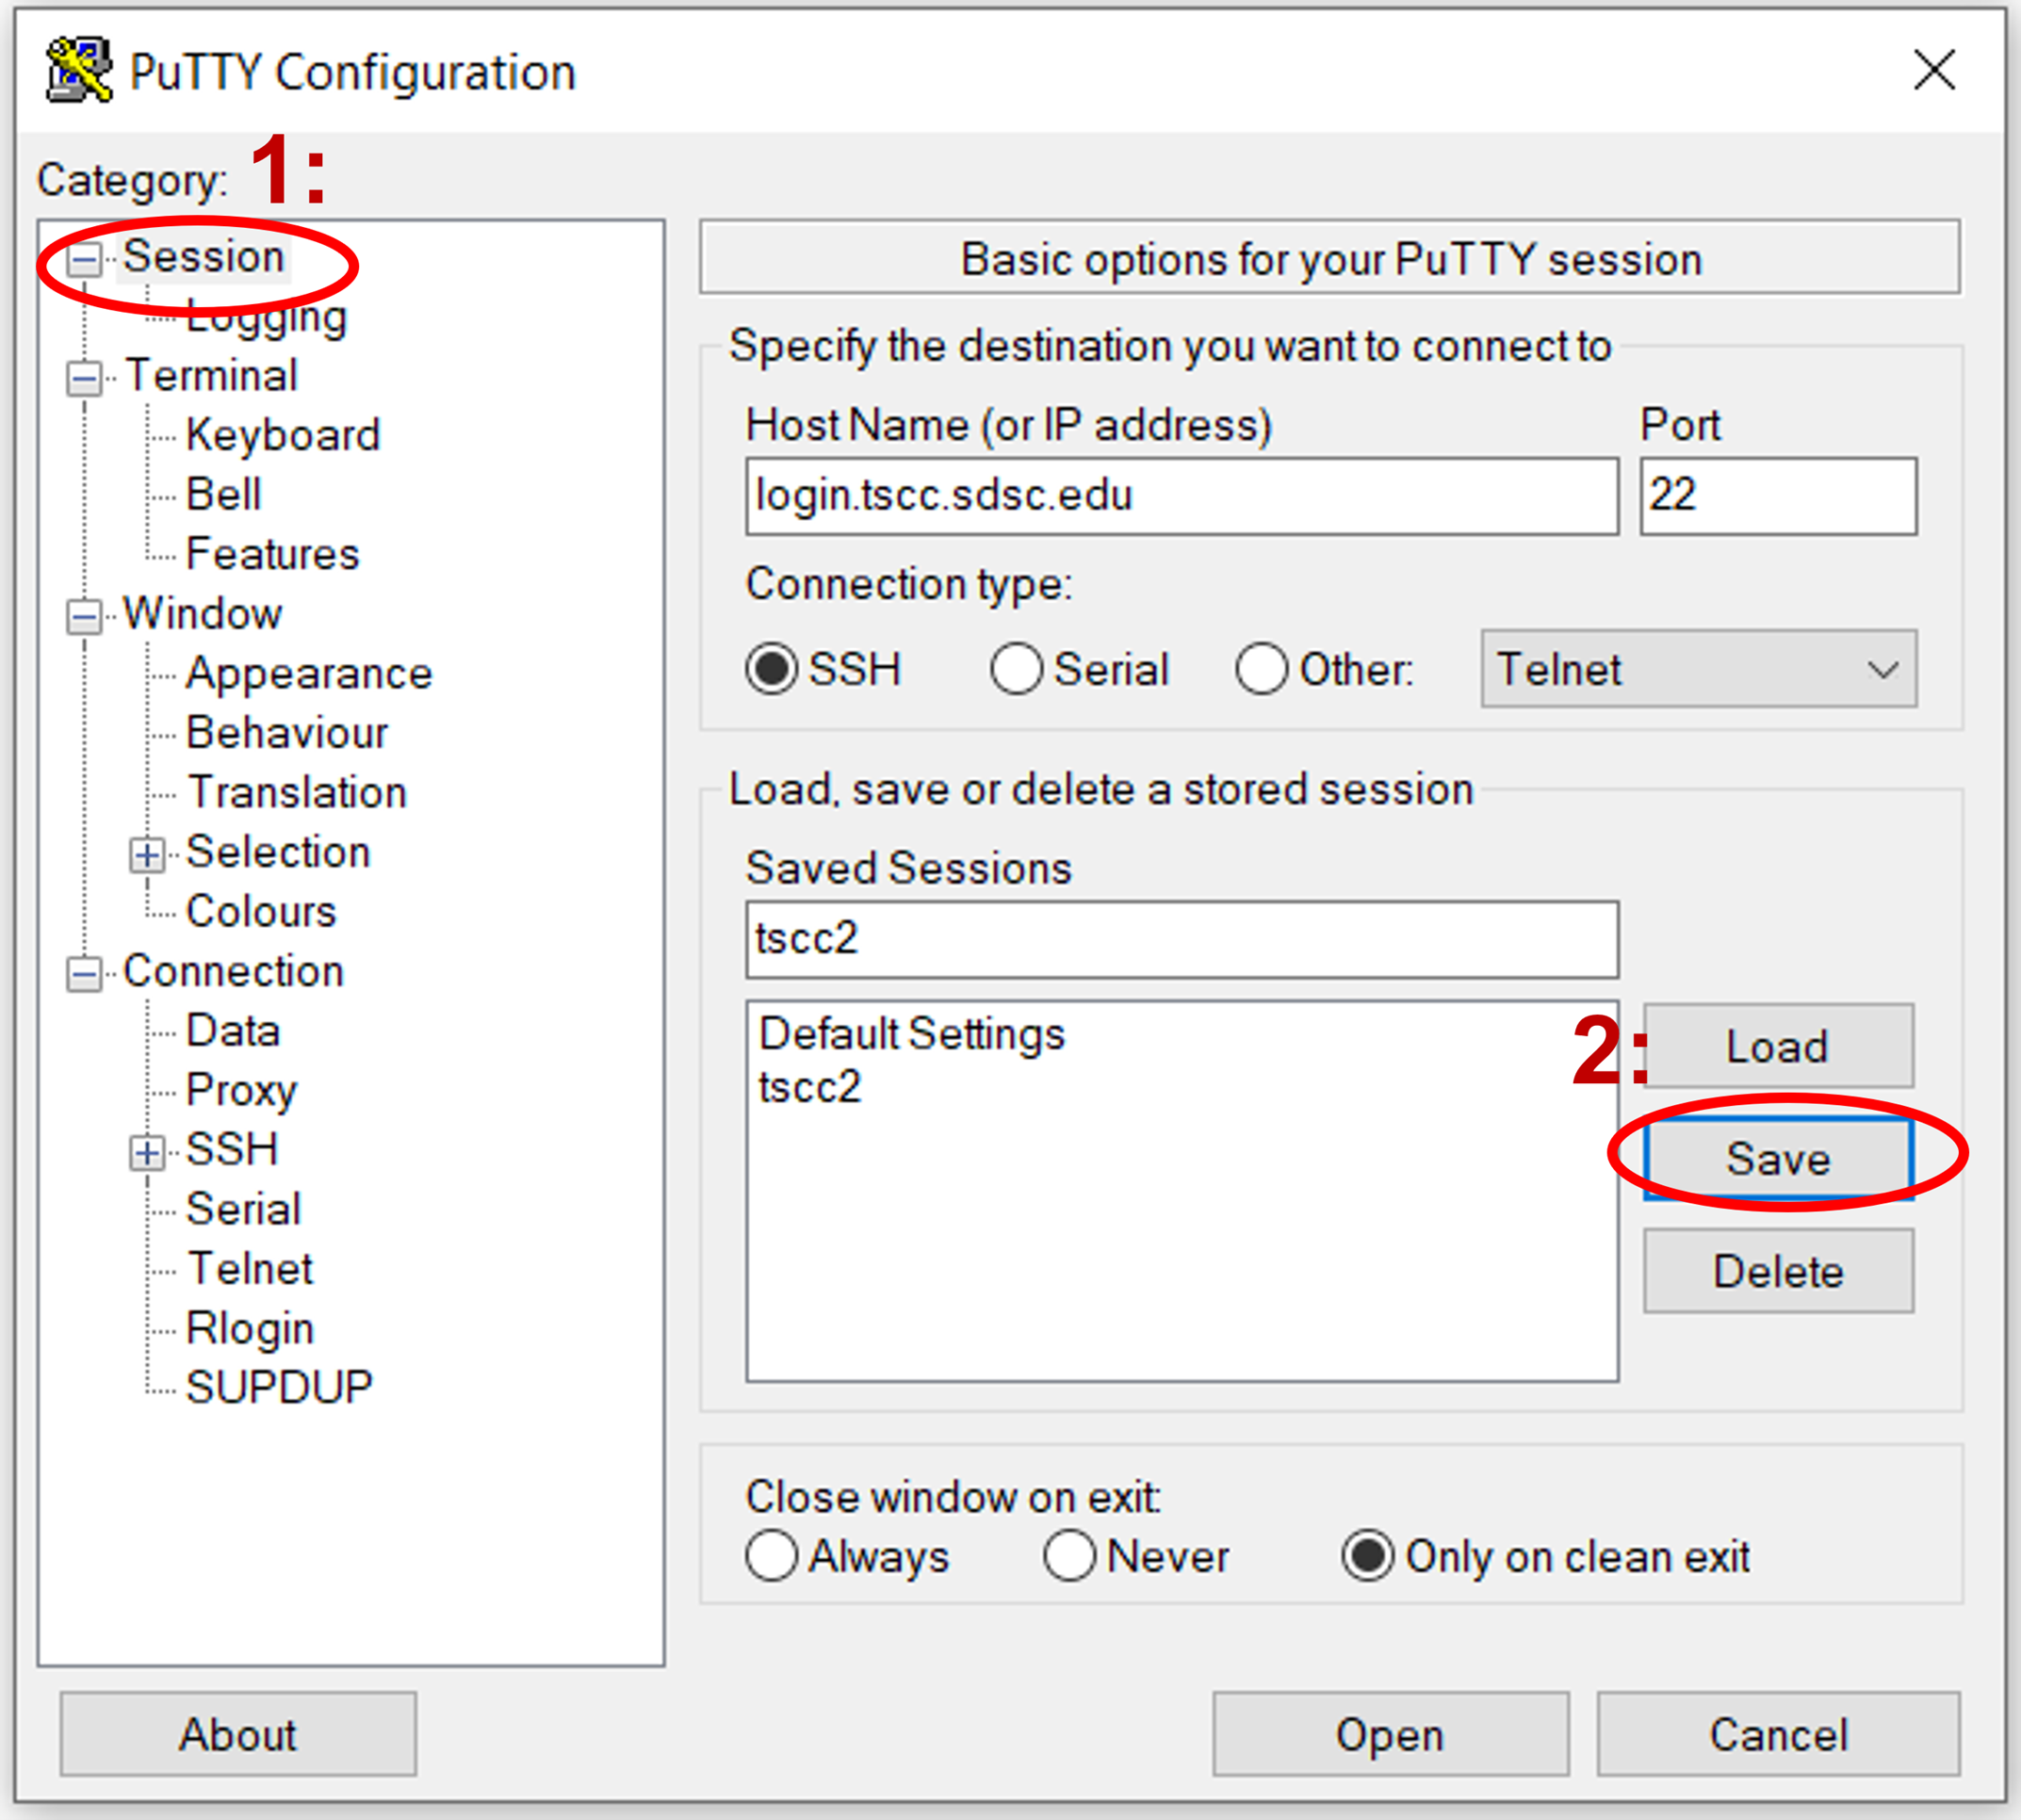
Navigate back to the sessions screen by clicking on "Session" at the top, then click "Save" to preserve these settings for subsequent sessions.
Running Jobs
TSCC harnesses the power of the Simple Linux Utility for Resource Management (SLURM) to effectively manage resources and schedule job executions. To operate in batch mode, users employ the sbatch command to dispatch tasks to the compute nodes. Please note: it's imperative that heavy computational tasks are delegated exclusively to the compute nodes, avoiding the login nodes.
Before delving deeper into job operations, it's crucial for users to grasp foundational concepts such as Allocations, Partitions, Credit Provisioning, and the billing mechanisms for both Hotel and Condo models within TSCC. This segment of the guide offers a comprehensive introduction to these ideas, followed by a detailed exploration of job submission and processing.
Allocations
An allocation refers to a designated block of service units (SUs) that users can utilize to run tasks on the supercomputer cluster. Each job executed on TSCC requires a valid allocation, and there are two primary types of allocations: the Hotel and the Condo. In TSCC, SUs are measured in minutes.
There are 2 types of allocations in TSCC, as described below.
Hotel Allocation
Hotel Allocations are versatile as they can be credited to users at any point throughout the year, operating on a pay-as-you-go basis. A unique feature of this system is the credit rollover provision, where unused credits from one year seamlessly transition into the next.
Hotel allocation names are in the form of htl###. E.g.: htl10. Allocations in htl100 (for individual users) and htl171 (for trial accounts) are individual allocation.
Note: For UCSD affiliates, the minimum hotel purchase is $352 (600,000 SUs in min). For other UC affiliates, the minimum hotel purchase is $563 (600,000 SUs in min).
Condo Allocation
Every year, Condo users receive credit allocations on an annual basis for 5 years based on the number and type of server they have purchased. It's crucial to note that any unused Service Units (SUs) won't carry over to the next year. Credits are consistently allocated on the 4th Monday of each September.
Condo allocation names may be of the form csd### or others. E.g.: csd792, ddp302.
The formula to determine the yearly Condo SU allocation is:
[Total cores of the node + (0.2 * Node's memory in GB) + (#RTX3090s * 20) + (#A40s *10) + (#RTXA6000s * 30)] * 365 days * 24 hours * 60 minutes * 0.97 uptime
writen in a more compact way:
(Total CPU cores of the node + ( .2 * Total memory of the node in GB)+ (Allocation factor * total GPU cards)) * 60 mins * 24 hours * 365 days * .97 uptime
Keep in mind the allocation factor in the table below:
|
GPU |
Allocation factor |
|
|
|
|
A40 |
10 |
|
RTX A6000 |
30 |
|
RTX3090 |
20 |
For example, suppose your group owns a 64-core node with 1024 GB in TSCC . The SUs added for the year to this node would be: [64 + (0.2 * 1024)] * 365 days * 24 hours * 60 minutes * 0.97 uptime = 328.8 * 509,382 = 137,042,841.6SUs in minutes for the calendar year.
The allocation time will be prorated on the first and fifth year based on when the server is added to the TSCC cluster.
Let's consider a simple example to better understand how the allocation of resources would work.
Assume that a 64-core. 1024 GB CPU node is added to TSCC 25 days prior to the next 4th Monday of September. When this node is added, the amount of SUs provissioned is:
(64 + (.2 * 1024)) * 509832 * 25 / 365 = 9,386,496 SUs (minutes)
Then, the 4th Monday of September, the amount reallocated to the node is:
(64 + (.2 * 1024)) * 509832 = 137,042,842 SUs (minutes)
Keep in mind that there is no roll over of any unused SUs from the previous year.
Checking available allocations
When searching for available allocations, you can use:
$ sacctmgr show assoc
For example:
$ sacctmgr show assoc user$USER format=account,user
Account User
---------- ----------
account_1 user_1
sacctmgr show assoc can also show all user accounts in your allocation:
$ sacctmgr show assoc account=use300 format=account,user
This can be useful for reviewing the members of a specific account and may help provide insights when troubleshooting an issue.
Note: The “account” in sacctmgr and other Slurm commands is Slurm accounts (rather than user account), which is used for allocation purposes.
Partitions
On a supercomputer cluster, partitions are essentially groups of nodes that are configured to meet certain requirements. They dictate what resources a job will use. It's important to note that a partition refers to a set of available resources, whereas an allocation refers to the specific resources assigned to a job from within that partition. In order to submit a job and get it running in the system, you need to keep in mind the specifications and limits of the partition you’re about to use.
$ scontrol show partition
This will show something like:
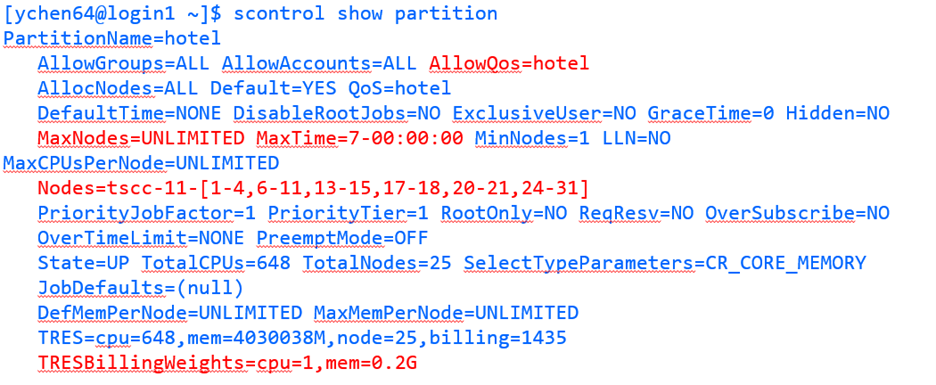
The default walltime for all queues is now one hour. Max walltimes are still in force per the below list.
If you want to obtain information about all the partitions in the system, you can alternatively use the following command:
$ scontrol show partitions
Note the ‘s’ at the end of the command.
For additional information, some of the limits for certain partitions are provided for each partition in the table below. The allowed QOS must be specified for each partition.
We'll be diving deeper into partitions in the Job Submission section later in this guide.
Quality of Service (QOS):
QOS for each job submitted to Slurm affects job scheduling priority, job preemption and job limits. QOS available are:
- hotel
- hotel-gpu
- Condo
- hcg- <project-name>
- hcp- <project-name>
- condo-gpu
- hca -<project-name>
In the previous list, <project-name> refers to the allocation id for the project. For TSCC (Slurm), that is the Account, or simply put, the group name of the user.
More on QOSs will be discussed in the Job submission section of this guide.
How to Specify Partitions and QOS in your Job Script
You are required to specify which partition and QOS you'd like to use in your SLURM script (*.sb file) using the #SBATCH directives. Keep in mind the specificactions of each QOS for the different parftitions as shown in tables 2 and 3. Here's an example for a job script that requests one node from the hotel partition:
#!/bin/bash
#SBATCH --partition=hotel
#SBATCH --QOS=hotel
#SBATCH --nodes=1
# ... Other SLURM options ...
# Your job commands go here
CPU nodes
|
Partition Name |
Max Walltime |
Allowed QOS |
|
hotel |
7 days |
hotel |
|
gold |
14 Days |
condo, hcg- <project-name> |
|
platinum |
14 Days |
condo, hcp- <project-name> |
Table 2: CPU Partitions information. hcg = [H]PC [C]ondo [G]old, hcp = [H]PC [C]ondo [P]latinum
GPU nodes
|
Partition Name |
Max Walltime |
Allowed QOS |
|
hotel_gpu |
48 Hrs |
hotel-gpu |
|
rtx3090 |
7 Days |
condo-gpu, hca -<project-name> |
|
a40 |
7 Days |
condo-gpu,hca-<project> |
Table 3: GPU Partitions information. hca = [H]PC [C]ondo [A]ccelerator
Job Charging in Condo
For condo allocations, the charging of the jobs is based on the memory and the number of cores used by the job. The charging also varies based on the type of GPU used.
Job Charge:
( (Total # cores/job + (.2 * Total memory requested/job) + (Total # A100/job * 60) + (Total # A40/job * 10) + (Total # RTX6000s/job * 30) + (Total # RTX3090s/job * 20) ) * Job runtime (in seconds)/60
Example using Job Charge:
Let's assume a researcher wants to run a job that requires:
- 16 cores
- 32GB of requested memory
- 1 A100 GPU
- The job has a runtime of 120 minutes (or 2 hours), or 7200 seconds.
Calculation
Given the formula, plug in the values:Core Charge: 16 cores
Memory Charge: 0.2 * 32GB = 6.4, but we'll use 6 in this case given that SLURM will only take integers for this calculations.
A100 GPU Charge: 1 A100 GPU * 60 = 60
Sum these charges: 16 + 6 + 60 = 82
Now, multiply by the job runtime: 82 * 7200 seconds / 60 = 9,840 SUs
Result
The total cost for running the job would be 9,888 Service Units. Charging is always based on the resources that were used by the job. The more resources you use and the longer your job runs, the more you'll be charged from your allocation.
Job Charging in Hotel
The formula used to calculate the job charging in hotel is as follows:(Total # cores/job + (.2 * Total memory requested/job) + (Total #GPU/job * 30)) * Job runtime (in seconds)/60
Example using Job Charge:Let's assume a researcher wants to run a job that requires:
- 16 cores
- 32GB of requested memory
- 1 A100 GPU
- The job has a runtime of 120 minutes (or 2 hours), or 7200 seconds.
Calculation
Given the formula, plug in the values:Note that in hotel there is no differentiation on the type of the GPU used. All GPUs have the same flat charging factor of 30.
Running Jobs in TSCC
Before diving into how to submit jobs interactively or non-interactively in TSCC, we need to clarify a few important concepts that are crucial for job performance and scheduling.
Slurm Job Partition
As discussed previously, in SLURM, a partition is a set of nodes where a job can be scheduled. On the TSCC system, partitions vary based on factors such as hardware type, maximum job wall time, and job charging weights, which determine the cost of running a job (as explained further in the job charging section). Each job submitted to SLURM must conform to the specifications and limits of the partition it is assigned to.
Please, refer to the table below to check for the different partitions in the Hotel and Condo programs.
|
Program |
Partitions |
|
Hotel |
hotel, hotel-gpu |
|
Condo |
condo, gold, platinum, a40, rtx3090, rtx6000 |
The TSCC partitions for each job submitted to SLURM differ primarily in hardware type. In the "Hotel" program, CPU nodes are assigned to the hotel partition, while GPU nodes are assigned to the hotel-gpu partition. In the "Condo" program, CPU nodes are added to either the condo, gold, or platinum partitions, depending on the job's requirements. GPU nodes in the Condo program, however, are allocated to one of the GPU-specific partitions such as a40, a100, rtx3090, or rtx6000, with no dedicated condo-gpu partition. This setup ensures that jobs are directed to the appropriate resources based on the type of computation needed.
To get information about the partitions, please use:
$ sinfo
a100 up 7-00:00:00 1 mix tscc-gpu-14-27
a100 up 7-00:00:00 2 alloc tscc-gpu-14-[25,29]
a100 up 7-00:00:00 1 idle tscc-gpu-14-31
a40 up 7-00:00:00 1 mix tscc-gpu-10-6
condo up 14-00:00:0 7 down* tscc-1-27,tscc-4-[17-18,41],tscc-11-58,tscc-13-26,tscc-14-39
condo up 14-00:00:0 8 comp tscc-1-[11,17,41],tscc-4-[15-16],tscc-11-50,tscc-13-[8,12]
condo up 14-00:00:0 30 mix tscc-1-[2-10,18,25-26,28-32,39-40],tscc-4-19,tscc-6-37,tscc-8-[35-36],tscc-9-[14,17],tscc-10-13,tscc-11-[49,54],tscc-13-2,tscc-14-24
condo up 14-00:00:0 4 alloc tscc-1-[1,35],tscc-13-11,tscc-14-1
condo up 14-00:00:0 80 idle tscc-1-[12-16,33-34,36-38,42-45],tscc-8-37,tscc-9-[15-16],tscc-11-[44,47-48,51-53,55-57,59,61-68,70-75,77],tscc-13-[1,9-10,13-14,27-29,32-37],tscc-14-[2-16,20-23,40-44]
...
To get specific information about one partition, please use:
$ sinfo -p <partition_name>
PARTITION AVAIL TIMELIMIT NODES STATE NODELIST
hotel* up 7-00:00:00 1 maint tscc-11-0
hotel* up 7-00:00:00 1 down* tscc-11-26
hotel* up 7-00:00:00 2 comp tscc-11-[27-28]
hotel* up 7-00:00:00 6 mix tscc-11-[1,4,29-32]
hotel* up 7-00:00:00 25 idle tscc-11-[2-3,5-8,10-25,33-35]
hotel-gpu up 2-00:00:00 1 drain tscc-gpu-m10-02
hotel-gpu up 2-00:00:00 1 resv tscc-gpu-1-01
hotel-gpu up 2-00:00:00 16 idle tscc-gpu-10-9,tscc-gpu-m10-[01,03-16]
SLURM Job Quality of Service (QOS)
In SLURM, Quality of Service (QOS) is a critical factor that influences various aspects of a job's execution, such as the maximum job wall time, scheduling priority, job preemption, and job limits. Each job submitted to SLURM is assigned a QOS, which determines how resources are allocated and how the job competes for scheduling. On TSCC, groups can have multiple QOS options. For example, the "Hotel" program includes hotel and hotel-gpu QOS, while the "Condo" program includes several QOS types, such as condo, condo-gpu, and specific QOS allocations like hcq, hcp, and hca, which are restricted to condo groups based on their ownership of specific node types, including gold, platinum, and GPU nodes. These QOS categories help manage and optimize resource use across different projects and hardware configurations.
The table below shows a summary of all available QOSs in the Hotel and Condo programs.
|
Program |
QOS |
|
Hotel |
hotel, hotel-gpu |
|
Condo |
condo, condo-gpu, hcg-<...>, hcp-<...>, hca-<...> |
To keep in mind:
hcg-<allocation>: [H]PC [C]ondo [G]old, only for condo groups who owns gold node(s)
hcp-<allocation>: [H]PC [C]ondo [P]latinum, only for condo groups who owns platinum node(s)
hca-<allocation>: [H]PC [C]ondo [A]ccellerator, only for condo groups who owns GPU node(s)
Checking available Quality of Service
To check your available Quality of Service (QOS) in SLURM, you can use the $ sacctmgr show assoc command:
$ sacctmgr show assoc user=$USER format=account,user,qos%50
Account User QOS
---------- ---------- --------------------------------------------------
account_1 user_1 hotel,hotel-gpu,normal
The information above illustrates the accessible or available QOSs for the allocation (account) you are part of. This means that, when submitting a job, you need to keep this in mind to ensure that SLURM can successfully schedule and run your job in a timely manner.
Also, you can check further characteristics of any QOS by running:
$ sacctmgr show qos format=Name%20,priority,gracetime,PreemptExemptTime,maxwall,MaxTRES%30,GrpTRES%30 where qos=hotel
Name Priority GraceTime PreemptExemptTime MaxWall MaxTRES GrpTRES
-------------------- ---------- ---------- ------------------- ----------- ------------------------------ ------------------------------
hotel 0 00:00:00 7-00:00:00 cpu=196,node=4
Here is a brief description of the columns in the table of the response above:
- Name: This is the name of the QOS. In this example, it's
hotel. - Priority: The priority level assigned to jobs submitted under this QOS. A higher value means jobs in this QOS will have higher scheduling priority.
- GraceTime: This represents the time allowed before a job is subject to preemption (if applicable). A value of
00:00:00means no grace time is provided. - PreemptExemptTime: The amount of time a job can run before becoming eligible for preemption.
- MaxWall: This is the maximum wall time (duration) that a job can run under this QOS. In this case, it is
7-00:00:00, meaning the job can run for a maximum of seven days. - MaxTRES: The maximum resources a single job can request, specified here as
cpu=196, node=4. This means a maximum of 196 CPUs and 4 nodes can be used by a job under this QOS. - GrpTRES: The maximum resources that a group or user can use collectively across all jobs under this QOS.
In SLURM, the Quality of Service (QOS) determines which partition a job can be submitted to. This mapping ensures that the job runs within the appropriate resource limits and scheduling policies defined for that QOS. When submitting a job, it is crucial to specify both the partition and the QOS to ensure that SLURM can properly allocate resources and schedule the job accordingly. Without matching the correct QOS and partition, the job may not run as expected or could be rejected.
|
QOS |
Partition |
|
hotel |
hotel |
|
hotel-gpu |
hotel-gpu |
|
condo |
condo |
|
hcp-<...> |
platinum |
|
hcg-<...> |
gold |
|
condo-gpu |
a40,rtx6000,rtx3090 |
|
hca-<...> |
the partition where your group’s GPU node is in |
Hotel QOS configuration
|
QOS |
Max Time/ Job |
Max Jobs submitted/Group* |
Max CPU,node,GPU /Group |
Max CPU,node,GPU/ User |
|
hotel |
7-00:00:00 |
196 |
cpu=196,node=4 |
|
|
hotel-gpu |
2-00:00:00 |
196 |
cpu=160,gpu=16,node=4 |
cpu=40,gpu=4,node=1 |
Condo QOS configuration
|
QOS |
Max Time / Job (defined in condo and GPU partitions) |
Max node/user |
|
condo |
14-00:00:00 |
4 |
|
condo-gpu |
7-00:00:00 |
4 |
Note: Jobs submitted with condo or condo-gpu QOS become preemptable after 8 hours (plus 30 min grace time).
hcq, hcp and hca QOS configuration
The hcq, hcp, and hca QOS configurations are used for jobs submitted to the gold, platinum, or GPU partitions, as there are no home queues or dedicated partitions for these QOS types. These configurations limit the total resources available to your group, based on the nodes you've purchased. Jobs submitted with these QOS options are not preemptible, have a high priority to start, and a maximum wall time limit of 14 days. Additionally, nodes are labeled with the appropriate QOS.
For example, if a PI purchases eight 36-core, 256 GB RAM nodes, the nodes are added to the gold partition, contributing 288 CPU cores and 2 TB of RAM. The QOS hcq-<allocation_name> would be available for the group’s jobs, with a total resource limit of either 288 CPUs, 2 TB of memory, or 8 nodes.
Multi-Category Security (MCS) labelling
In Multi-Category Security (MCS) labeling, jobs submitted to the platinum, gold, or GPU partitions with the hcq, hcp, or hca QOS are labeled based on the group or allocation name. This labeling ensures that if a job from a PI's group is running on a node with their QOS, the entire node is labeled for that group, preventing jobs from other groups from being scheduled on the same node. As a result, only jobs from the same group and QOS can utilize the remaining resources on that node.
MCS labeling is applied to make job assignment easier for SLURM, as it clearly defines which jobs can run on which nodes. Additionally, it enhances security by ensuring that resources are only accessible to the group that owns the node for that particular job.
Using srun for interactive Job submission
Note: It is absolutely crucial not to run computational programs, applications, or codes on the login nodes, even for testing purposes. The login nodes are specifically designed for basic tasks such as logging in, file editing, simple data analysis, and other low-resource operations. Running computationally intensive tasks on the login nodes can negatively impact other users' activities, as they share the same login node. By overloading the login node, your tests or programs can slow down or interfere with the login and basic tasks of other users on the system. To maintain system performance and ensure fair resource use, it is crucial to restrict computational work to the appropriate compute nodes and use login nodes only for light tasks.
Now that we have a grasp on the basic concepts explained above, we can start going deep on how to submit and monitor jobs for effecitve use of computational resource.
The first type of job we're going to discuss is the Interactive job. An interactive job allows users to set up an interactive environment on compute nodes. The key advantage of this setup is that it enables users to run programs interactively. However, the main drawback is that users must be present when the job starts. Interactive jobs are typically used for purposes such as testing, debugging, or using a graphical user interface (GUI). It is recommended not to run interactive jobs with a large core count, as this can be a waste of computational resources.
You can use the srun command to request an interactive session. Here's how to tailor your interactive session based on different requirements:
srun -t short for --time hh:mm:ss \
-N short for --nodes, number of nodes \
-n short for --ntasks, total number of tasks to run job on \
--ntasks-per-node optional to --ntasks \
-c short for --cpus-per-task, number of threads per process* \
-A* short for --account <Allocation> \
-p short for --partition <partition name> \
-q short for --qos \
-G short for --gpus number of GPU card \
--mem , memory (details later) \
--x11 , enabling X11 forwarding \
--pty , in pseudo terminal \
bash , executable to run
NOTE
The “account” in Slurm commands like srun is Slurm accounts (rather than user account), which is used for allocation purposes.
Example: Requesting a Compute Node
To request one regular compute node with 1 core in the hotel partition for 30 minutes, use the following command:
$ srun --partition=hotel --pty --nodes=1 --ntasks-per-node=1 -t 00:30:00 -A xyz123 --qos=hotel --wait=0 --export=ALL /bin/bash
In this example:
- --partition=hotel: Specifies the debug partition.
- --pty: Allocates a pseudo-terminal.
- --nodes=1: Requests one node.
- --ntasks-per-node=1: Requests 1 tasks per node.
- -t 00:30:00: Sets the time limit to 30 minutes.
- -A xyz123: Specifies the account.
- --wait=0: No waiting.
- --export=ALL: Exports all environment variables.
- --qos=hotel: Quality of Service.
- /bin/bash: Opens a Bash shell upon successful allocation.
A more advanced version of interactive jobs may include using MPI:
$ srun --overlap -n 8 <mpi_executable>
where the --overlap flag is required for interactive + MPI, otherwise srun will hang.
For properly setting your job so it runs in a timely manner and doesn't hang, one key aspecto to consider is the allocated or requested CPU to the job. The table below shows the maximum CPU that can be requested out of a node:
|
Partition |
Max CPU per Node |
|
hotel |
28 |
|
condo |
64 |
|
gold |
36 |
|
platinum |
64 |
For example, if you consider the submission of the two interactive jobs below, you will see that both will be able to start because each requests at most the maximum number of CPUs allowed by the partition:
$ srun -N 2 -n 128 -c 1 -p condo -q condo -A account_1 -t 8:00:00 --pty bash
$ srun -N 2 -n 2 -c 60 -p condo -q condo -A account_1 -t 8:00:00 --pty bash
Both jobs request 2 nodes (-N 2), and each node is from a condo partition, which allows a maximum of 64 CPUs per node.
-
For the first job, the total number of requested CPUs is calculated as 1 (
-cparameter) multiplied by 128 (-nparameter), resulting in 128 CPUs across the 2 requested nodes. Since each node can provide 64 CPUs, the total requested (128 CPUs) exactly matches the available CPUs across the two nodes (64 CPUs per node x 2 nodes = 128 CPUs). -
For the second job, the total number of requested CPUs is 60 (
-cparameter) multiplied by 2 (-nparameter), which equals 120 CPUs across the two condo nodes. Together, the two nodes provide a total of 128 CPUs, which is sufficient to accommodate the 120 CPUs requested by the job.
By the same logic, the next job submission should fail right away given that the amount of requested CPUs is larger than the one that can be provided by the requested nodes:
$ srun -N 2 -n 129 -c 1 -p condo -q condo -A account_1 -t 8:00:00 --pty bash
Requesting more nodes (-N > 1) can increase the maximum number of CPUs available to a job; however, you should ensure that your program can efficiently run across multiple nodes. It is generally recommended to use CPUs from the same node whenever possible. For example, if you need to use a total of 8 CPUs, it is not recommended to request -N 2 -n 4, which would distribute the tasks across two nodes. Instead, you should request -N 1 -n 8 to use all 8 CPUs on a single node, optimizing resource usage and reducing unnecessary overhead.
Also, consider how much memory you will allocate to your job. The default memory allocated to a job in SLURM is 1GB per CPU core. The default unit of memory is MB, but users can specify memory in different units such as "G", "GB", "g", or "gb". Users are allowed to specify the memory requirements for their job, but it is recommended to choose an appropriate amount to ensure the program runs efficiently without wasting computational resources. The charging factor for memory usage is 0.2 per GB. The maximum amount of memory a user can request is specified on the following table. It's advisable to run small trial tests before large production runs to better estimate the memory needs.
|
Partition |
Max memory (GB) in --mem |
|
hotel |
187 |
|
hotel-gpu |
755 |
|
condo |
1007 |
|
gold |
251* |
|
platinum |
1007 |
|
a100/a40/rtx6000/rtx3090 |
1007/125/251/251 |
The --mem flag is used to specify the amount of memory on one node. Requesting more nodes can allocate more memory to the job. However, you need first to ensure that your job can run on multiple nodes.
GPU Jobs
GPU jobs should be submitted by specifying the --gpus (or -G) option. For example, using --gpus 2 will allocate 2 GPU cards to the job. If requesting multiple GPUs, ensure that your program can utilize all of them efficiently. Different nodes offer varying GPU configurations; for instance, all hotel GPU nodes and Condo A100/A40 nodes have 4 GPUs per node, while Condo RTX A6000 and RTX 3090 nodes have 8 GPUs per node. Allocated GPUs are referenced through the CUDA_VISIBLE_DEVICES environment variable, and applications using CUDA libraries will automatically discover the assigned GPUs through this variable. You should never manually set the CUDA_VISIBLE_DEVICES variable.
Submitting Batch Jobs Using sbatch
To submit batch jobs, you will use the sbatch command followed by your SLURM script. Here is how to submit a batch job:
$ sbatch mycode-slurm.sb
> Submitted batch job 8718049
In this example, mycode-slurm.sb is your SLURM script, and 8718049 is the job ID assigned to your submitted job.
In this section, we will delve into the required parameters for job scheduling in TSCC. Understanding these parameters is crucial for specifying job requirements and ensuring that your job utilizes the cluster resources efficiently. Required Scheduler Parameters
- --partition (-p): Specifies which partition your job will be submitted to. For example, --partition=hotel would send your job to the hotel partition.
- --qos (-q): Specifies which QOS your job will be used.
- --nodes (-N): Defines the number of nodes you need for your job.
- --ntasks-per-node OR --ntasks (-n): Indicates the number of tasks you wish to run per node or in total, respectively. If both are specified, SLURM will choose the value set for --ntasks.
- --time (-t): Sets the maximum time your job is allowed to run, in the format of [hours]:[minutes]:[seconds].
- --account (-A): Specifies the account to which the job should be charged.
- --gpus: Indicates the total number of GPUs needed by your job.
Examples
Example 1: Submitting to 'hotel' Partition
Let's say you have a CPU-intensive job that you'd like to run on one node in the ‘hotel’ partition, and it will take no more than 2 hours. Your SLURM script may look like this:
|
|
Example 2: Submitting to ‘hotel-gpu’ Partition
Suppose you have a job requiring 1 GPUs, shared access, and expected to run for 30 minutes. Here's how you could specify these requirements:
|
|
Where tensorflowtest.py can be a simple Hello world script such as:
|
|
Example 3: OpenMP Job
OpenMP (Open Multi-Processing) is an API that supports multi-platform shared-memory parallel programming in C, C++, and Fortran. It allows you to write programs that can run efficiently on multi-core processors. By using OpenMP directives, you can parallelize loops and other computational blocks to run simultaneously across multiple CPU cores, thereby improving performance and reducing execution time.
To run an OpenMP job in TSCC, you can use the following batch script as a template. This example is for a job that uses 16 CPU cores on a single node in the shared partition. The test script at the end of the template called ‘pi_openmp’ is located here: /cm/shared/examples/sdsc/tscc2/openmp. To run the bash script with the test script, copy the entire openmp directory to your own space, and from there execute the batch job:
!/bin/bash#SBATCH --job-name openmp-slurm #Optional, short for --job-name #SBATCH --output slurm-%j.out-%N # Standard output file#SBATCH --output slurm-%j.err-%N # Optional, for separating standard error#SBATCH --partition hotel # Partition name#SBATCH --qos hotel # QOS name#SBATCH --nodes 1 # Number of nodes#SBATCH --ntasks 1 # Total number of tasks#SBATCH --cpus-per-task 8 # Number of CPU cores per task#SBATCH --allocation <allocation> # Allocation name#SBATCH --export=ALL #Optional, Export all environment variables#SBATCH --time 01:00:00 # Walltime limit#SBATCH --mail-type END #Optional, Send mail when the job ends#SBATCH --mail-user <email> #Optional, Send mail to this address # GCC environmentmodule purge # Purge all loaded modulesmodule load slurm # Load the SLURM modulemodule load cpu # Load the CPU modulemodule load gcc # Load the GCC compiler module# Set the number of OpenMP threadsexport OMP_NUM_THREADS=8# Run the OpenMP job./pi_openmp |
Breakdown of the Script
- --job-name: Specifies the job name.
- --output: Sets the output file where stdout and stderr are saved. SLURM merges stdout and stderr by default. See the above OpenMP job script example for separating stderr.
- --partition: Chooses the partition.
- --qos: Chooses the QOS.
- --nodes, --ntasks, --cpus-per-task: Define the hardware resources needed.
- --export: Exports all environment variables to the job's environment.
- --time: Sets the maximum runtime for the job in hh:mm:ss format.
- module load: Loads necessary modules for the environment.
- export OMP_NUM_THREADS: Sets the number of threads that the OpenMP job will use.
Example 4: GPU Job
#!/bin/bash
|
The script in the previous example can be found in here:
/cm/shared/examples/sdsc/tscc2/amber/gpu/amber-slurm.sb
Note the #SBATCH -G 1 parameter used to request 1 GPU
Example Application Scripts:
Navigate to:
$ ls /cm/shared/examples/sdsc/tscc2/
abinit amber cp2k cpmd gamess gaussian gromacs lammps namd nwchem qchem quantum-espresso siesta vasp openmp mpi
This directory holds test scripts for applications like abinit, vasp, and more, optimized for both GPU and CPU nodes.
Look for the testsh scripts or *.sb file within each folder. Although you can't execute any script directly from here, you can copy them—and the entire application directory—to your own space to run it. This will help you avoid dependency issues.
Important Note on submitting jobs
You always must specify the allocation name in your job request, whether it is Condo or Hotel partition, interactive or batch job. Please, add --account=<allocation_name> (-A=<allocation_name>) to your srun command, or #SBATCH --account=<allocation_name> (#SBATCH -A=<allocation_name>) to your job scripts. You can run the command " sacctmgr show assoc user=$USER format=account,user " to find out your allocation name.
$ sacctmgr show assoc user=$USER format=account,user
Account User---------- ----------account_1 user_1
Checking Job Status
You can monitor the status of your job using the squeue command:
$ squeue -u $USER
JOBID PARTITION NAME USER ST TIME NODES NODELIST(REASON)
8718049 hotel mycode user PD 0:00 1 (Priority)
- JOBID: This is the unique identification number assigned to each job when it is submitted. You will use this JOBID when you wish to cancel or check the status of a specific job.
- PARTITION: This indicates which partition (or queue) the job is submitted to. Different partitions have different resources and policies, so choose one that fits the job's requirements.
- NAME: This is the name of the job as specified when you submitted it. Naming your jobs meaningfully can help you keep track of them more easily.
- USER: This field shows the username of the person who submitted the job. When you filter by $USER, it will display only the jobs that you have submitted.
- ST: This stands for the status of the job. For example, "PD" means 'Pending,' "R" means 'Running,' and "C" means 'Completed.'
- TIME: This shows the elapsed time since the job started running. For pending jobs, this will generally show as "0:00".
- NODES: This indicates the number of hotel nodes allocated or to be allocated for the job.
- NODELIST(REASON): This provides a list of nodes assigned to the job if it's running or the reason why the job is not currently running if it's in a pending state.
Once the job starts running, the status (ST) will change to R, indicating that the job is running:
$ squeue -u $USER
JOBID PARTITION NAME USER ST TIME NODES NODELIST(REASON)
8718049 hotel mycode user R 0:02 1 tscc-14-01
Also, you can check details on your group's queue:
$ squeue -A <allocation>
JOBID PARTITION NAME USER ST TIME TIME_LIMI NODES NODELIST(REASON)
78 hotel bash user_1 R 2:20:38 12:00:00 1 tscc-11-70
And also per partition using the -p flag:
$ squeue -p a40
JOBID PARTITION NAME USER ST TIME NODES NODELIST(REASON)
2435621 a40 jupyter jjalili R 21:28:15 1 tscc-gpu-10-6
2437644 a40 jupyter r2gonzal R 2:03:21 1 tscc-gpu-10-6
Finally, you can check the queue specifying the nodes like this:
$ squeue -w tscc-11-[29-32]
JOBID PARTITION NAME USER ST TIME NODES NODELIST(REASON)
2437393 hotel galyleo- qiw071 R 3:50:50 1 tscc-11-29
2439008 hotel bash jlykkean R 7:08 1 tscc-11-32
2437796 hotel bash jjmeredi R 1:51:00 1 tscc-11-31
2436336 hotel Trichocl dwc001 R 17:19:16 1 tscc-11-30
2437612 hotel galyleo- ssharvey R 2:13:13 1 tscc-11-29
$ echo $SQUEUE_FORMAT2
JobID:.12 ,Partition:.9 ,QOS:.10 ,Name:.8 ,UserName:.10 ,State:.6,TimeUsed:.11 ,TimeLimit:.11,NumNodes:.6,NumCPUs:.5,MinMemory:.11 ,ReasonList:.50
$ squeue -w tscc-11-[29-32]
JOBID PARTITION QOS NAME USER STATE TIME TIME_LIMIT NODES CPUS MIN_MEMORY NODELIST(REASON)
2437393 hotel hotel galyleo- qiw071 RUNNIN 4:00:43 9:00:00 1 2 1G tscc-11-29
2439008 hotel hotel bash jlykkeande RUNNIN 17:01 2:00:00 1 10 1G tscc-11-32
2439066 hotel hotel bash c1seymour RUNNIN 2:22 4:00:00 1 4 4G tscc-11-29
2437796 hotel hotel bash jjmeredith RUNNIN 2:00:53 6:00:00 1 12 1G tscc-11-31
2436336 hotel hotel Trichocl dwc001 RUNNIN 17:29:09 6-01:00:00 1 16 187G tscc-11-30
2437612 hotel hotel galyleo- ssharvey RUNNIN 2:23:06 1-00:00:00 1 2 180G tscc-11-29
Canceling Jobs
To cancel a running or a queued job, use the scancel command:
$ scancel 8718049
Information on the Partitions
$ sinfo
Checking Available Allocation
$ sacctmgr show assoc user=$USER format=account,user
Check details of your job by running scontrol:
$ scontrol show job <job-id>
Also, check elapsed time for a running or finished job:
$ sacct --format=Elapsed -j <job-id>
$ top:PID USER PR NI VIRT RES SHR S %CPU %MEM TIME+ COMMAND3178080 user_1 20 0 36.1g 2.3g 18800 S 257.3 1.2 2:38.58 java3178013 user_2 20 0 36.0g 2.0g 18684 S 241.1 1.1 2:40.34 java3167931 user_3 20 0 979964 888352 3100 R 97.0 0.5 67:35.84 samtools3083257 user_4 20 0 389340 107964 14952 S 1.0 0.1 1:28.24 jupyter-lab3177635 user_4 20 0 20304 5424 3964 R 1.0 0.0 0:00.62 top$ free -h
total used free shared buff/cache available
Mem: 125G 6.1G 112G 200M 7.0G 118G
Swap: 2.0G 1.9G 144M
nvidia-smi (NVIDIA System Management Interface) command is another powerful tool used for monitoring and managing GPUs on a system. It provides information such as GPU utilization, memory usage, temperature, power consumption, and the processes currently using the GPU. You should be logged in to the GPU node first in order to be able to run this command:
$ nvidia-smi
Tue Sep 24 00:06:17 2024
+---------------------------------------------------------------------------------------+
| NVIDIA-SMI 530.30.02 Driver Version: 530.30.02 CUDA Version: 12.1 |
|-----------------------------------------+----------------------+----------------------+
| GPU Name Persistence-M| Bus-Id Disp.A | Volatile Uncorr. ECC |
| Fan Temp Perf Pwr:Usage/Cap| Memory-Usage | GPU-Util Compute M. |
| | | MIG M. |
|=========================================+======================+======================|
| 0 Tesla P100-PCIE-16GB On | 00000000:04:00.0 Off | 0 |
| N/A 36C P0 53W / 250W| 2632MiB / 16384MiB | 86% Default |
| | | N/A |
+-----------------------------------------+----------------------+----------------------+
| 1 Tesla P100-PCIE-16GB On | 00000000:05:00.0 Off | 0 |
| N/A 35C P0 26W / 250W| 0MiB / 16384MiB | 0% Default |
| | | N/A |
+-----------------------------------------+----------------------+----------------------+
+---------------------------------------------------------------------------------------+
| Processes: |
| GPU GI CI PID Type Process name GPU Memory |
| ID ID Usage |
|=======================================================================================|
| 0 N/A N/A 67028 C ...iqo2tw4hqbb4mluy/bin/pmemd.cuda.MPI 370MiB |
| 0 N/A N/A 67029 C ...iqo2tw4hqbb4mluy/bin/pmemd.cuda.MPI 370MiB |
+---------------------------------------------------------------------------------------+
Managing User Account
On TSCC we have set up a client that provides important details regarding project availability and usage. The client script is located at:
/cm/shared/apps/sdsc/1.0/bin/tscc_client.sh
The script requires the `sdsc` module, which is loaded by default. However, you can simply run:
$ module load sdsc
$ which tscc_client
/cm/shared/apps/sdsc/1.0/bin/tscc_client
to ensure that the client is ready for use.
To start understanding the usage of the client, simply run:
$ tscc_client -h
Activating Modules:
1) slurm/tscc/23.02.7

Usage: /cm/shared/apps/sdsc/1.0/bin/tscc_client [[-A account] [-u user|-a] [-i] [-s YYYY-mm-dd] [-e YYYY-mm-dd]
Notice that you can either run `tscc_client` or `tscc_client.sh`.
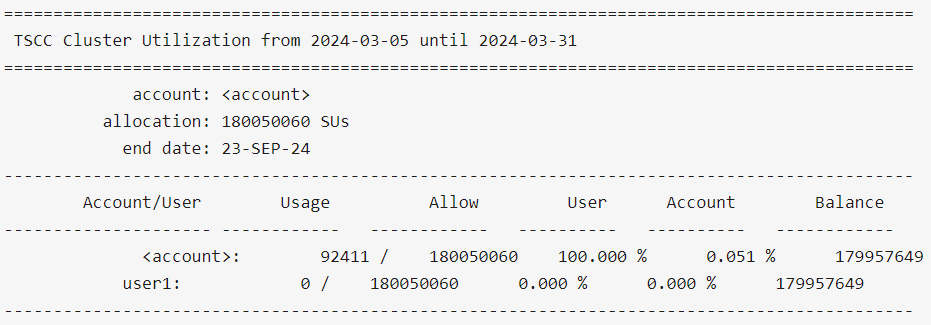
To get information about balance and usage of an specific allocation, you can run:
$ tscc_client -A <account>
The code above should retrieve something like:

The 'Account/User' column shows all the users belonging to the Allocation. 'Usage' column shows how much SUs each user has used up until now. 'Allow' column shows how much SUs each user is allowed to use within the allocation. In the example above, each user is allowed to use the same amount except for `user_8` and `user_13`, given that there might be cases in which the allowed SUs per user can be different. 'User' column represents the total percentage used by user relative to their allowed usage ('Allow' column value). In this case, `user_13` has used 0.049% of the total 18005006 SUs available to him/her. 'Balance' represents the remainins SUs each user can still use. Given that `user_13` has used 8923 SUs of the total 18005006 SUs initially available to him/her, then `user_13` has still access to 18005006 SUs - 8923 SUs = 17996083 SU, which is exactly what is shown in the table for that user, in the Column 'Balance'.
Let's assume the case in which a user A submits a simple Job like the one we saw previously in the Hotel partition example:
- 16 cores
- 32GB of requested memory
- 1 A100 GPU
- The user has requested a walltime of 120 minutes (or 2 hours), or 7200 seconds.
From the example above, we know the Job will consume 6,240 SUs only if it uses the whole time of the walltime. When user A submits this job, and while the job is in Pending or Running state, the scheduler will reduce the total amount of 6,240 SUs from the total balance of the allocation, meaning that if the allocation initially had access to 10,000 SUs before user A submitted the job, right after the submission the allocation will only have an allowed balance of 10,000 SUs - 6,240 SUs = 3,760 SUs.
Let's say that user B from same allocation of user A wants to submit another job. If user B requests more resources that currently available, in this case 3,760 SUs, the job will automatically fail with an error like: `Unable to allocate resources: Invalid qos specification`. That is because at the moment of the submission of user B's job, there weren't enough resources available in the allocation.
However, rememer that the walltime requested by a user when submitting a job doesn't necesarily force that the job uses the whole time to reach completion. It might be the case that user A's job only ran for 1h out of the 2h requested. That means that when the job finishes either because it fails or because it ends gracefully, the amount of used SUs by user A during that 1h is 3,120 SUs. That means that right after the job is done running, the allocation will have 10,000 SUs - 3,120 SUs = 6,880 SUs available for the rest of the users.
This simple example illustrates the usefulness of the client when users are trying to best use their available resources inside the same allocation, and give more insight about why some jobs are kept pending or fail.
The client also shows information by user:
$ tscc_client -u user1
$ tscc_client -a -s 2024-01-01 -e 2024-06-30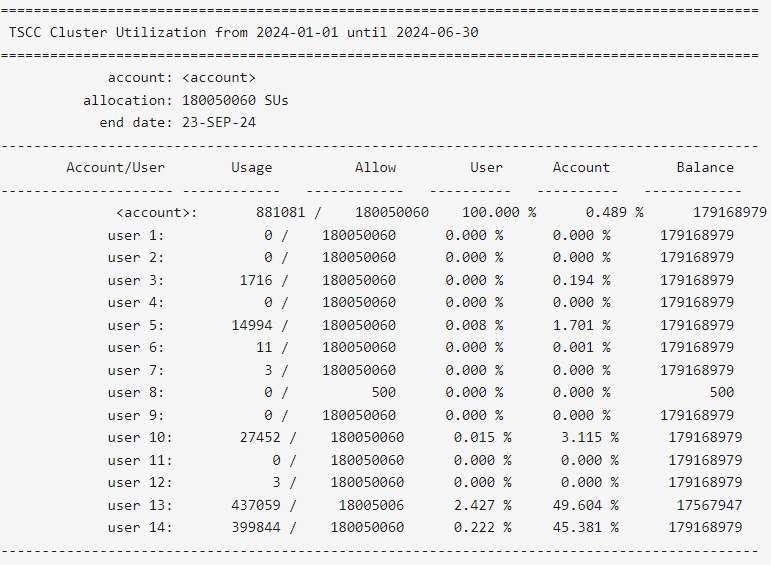
-s YYYY-MM-DD option with tscc_client.sh to include dates prior to the reset in their reporting output.
$ tscc_client -h and/or $ man sreport.Find account(s) by description substring match
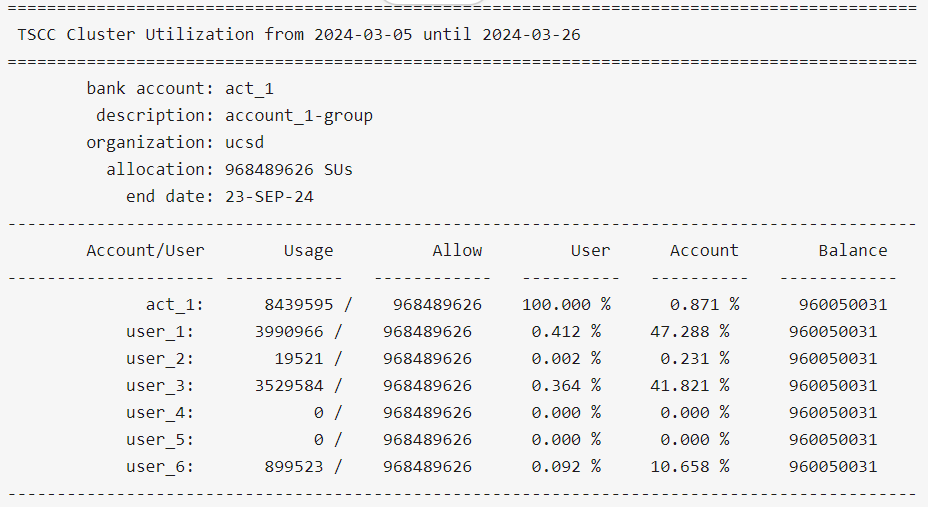
Let's say you want to filter results by partial substrings of account names. You can get useful information by running:
$ tscc_client -d account_1
Important Note:
Do not try to run for loops or include the client into a script that could result in multiple database invokations, such as:
#!/bin/bash# Assuming user_ids.txt contains one user ID per line# And you want to grep "Running Jobs" from the tscc_client command outputwhile read -r user_id; do echo "Checking jobs for user: $user_id" tscc_client some_command some_flags --user "$user_id" | grep "Running Jobs"done < user_ids.txt |
Doing this might bog down the system.
Users who try to run these kind of scripts or commands will have their account locked.